

Why Copper Demand Is Rising: EVs, AI, Grid Expansion & the Energy Transition
Copper demand is rising globally due to electrification, renewable energy, electric vehicles, and data centre infrastructure. These structural trends are increasing pressure on supply, contributing to a growing imbalance between copper demand and supply. As copper becomes more central to modern economies, it is increasingly viewed as a strategic resource within the global commodities market.
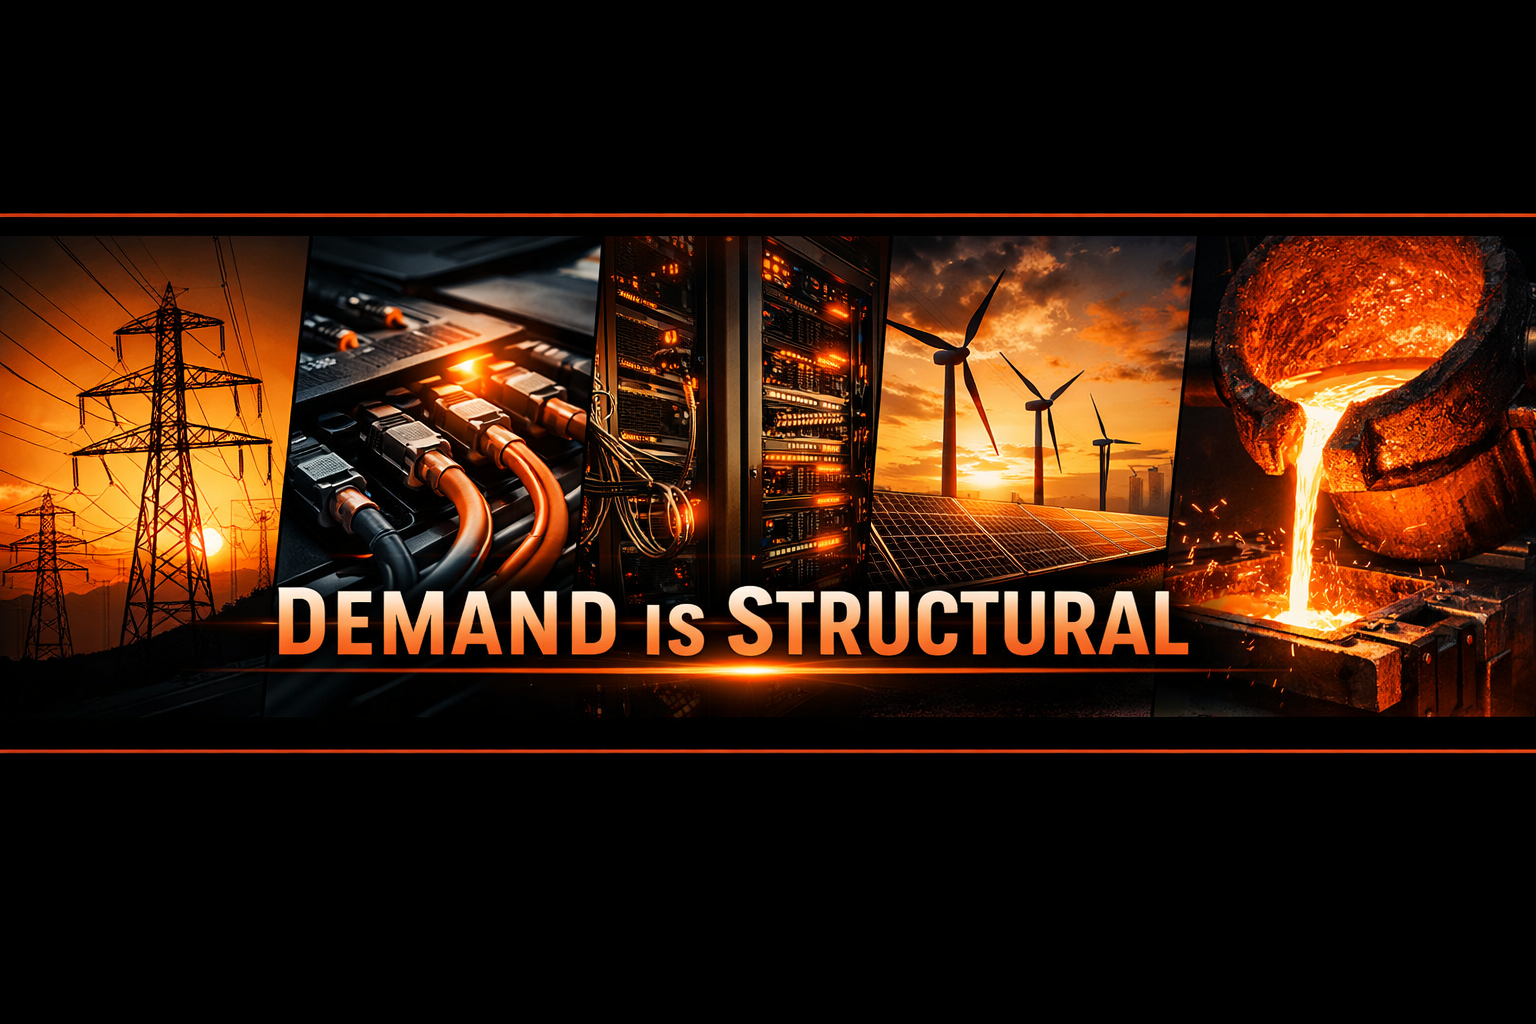
Why Copper Demand Is Increasing
The energy transition, AI infrastructure, and electrification are creating structural demand that the mining industry cannot keep pace with.
The World Is Being Rewired. Copper Is the Wire.
Global copper demand is projected to double by 2035, according to the IEA (2024). Right now, the world consumes roughly 26 million tonnes of copper per year. Mines produce around 22 million tonnes. That gap is not a blip. It is a structural deficit that is widening as demand accelerates and new supply takes 15 to 20 years to bring online.
The reasons behind this demand surge are not speculative. They are encoded into the infrastructure choices governments, utilities, and technology companies are making right now: electric vehicles, renewable energy installations, AI data centres, and grid upgrades. All of them run on copper.
"Global copper demand is projected to double by 2035. Mine supply currently falls 4 million tonnes short of annual consumption."
— IEA, 2024
Electric Vehicles: The Most Copper-Intensive Shift in Transport History
A conventional petrol or diesel car contains around 23 kg of copper. An electric vehicle contains roughly 83 kg, approximately four times as much. That copper goes into the motor windings, battery pack connections, onboard wiring harnesses, and thermal management systems.
And the car itself is only part of the picture. Every public charging point requires copper cable runs back to a transformer, and every transformer upgrade requires more copper still. As EV adoption accelerates across Europe, North America, and China, the cumulative copper requirement grows at every point in the chain.
A single electric vehicle uses approximately 83 kg of copper, versus 23 kg in a conventional car. Battery-electric buses and trucks use even more. Charging infrastructure adds further demand at the grid level.
Renewable Energy: Solar, Wind, and the Grid Behind Them
Renewable energy generation is significantly more copper-intensive than the fossil fuel systems it replaces. A solar farm uses five times more copper per megawatt than a gas-fired power plant. An offshore wind turbine contains 8 to 15 tonnes of copper in its nacelle, cabling, and transformer connections alone.
Beyond generation, there is the grid itself. Integrating variable renewables requires new transmission lines, upgraded substations, and smart grid infrastructure. The IEA estimates that grid copper investment will need to roughly triple by 2030 to meet net-zero commitments. None of this gets built without significant copper procurement.
AI and Data Centres: The Hidden Copper Demand Driver
The artificial intelligence boom has created a surge in data centre construction that most commodity analysts did not price into their models two years ago. A single large-scale AI data centre requires as much copper wiring as 30,000 homes, running through power distribution systems, cooling infrastructure, and server rack connectivity.
Microsoft, Google, Amazon, and Meta have each committed to multi-billion-dollar data centre expansion programmes for 2025 and beyond. Every one of those facilities represents a significant copper order. This demand is not tied to a commodity cycle. It is tied to compute capacity, and compute capacity is growing regardless of copper price.
"One AI data centre requires as much copper as 30,000 homes. The hyperscaler buildout is only accelerating."
Emerging Markets: Urbanisation and Infrastructure Buildout
The demand story is not only a Western or tech-sector story. Across India, Brazil, Indonesia, Nigeria, and Egypt, rapid urbanisation is driving construction of the kind of electrical infrastructure that developed economies built decades ago. New housing, commercial buildings, transport networks, and industrial facilities all require copper at scale.
India alone is expected to add the equivalent of a new city of one million people every year for the next two decades. Each of those developments requires power distribution, wiring, and appliances. The copper intensity of emerging market growth is structurally comparable to the industrialisation of China between 1990 and 2010, which drove the last major commodity supercycle.
Copper is traded on the London Metal Exchange in US dollars. It is not tied to the performance of any single national currency. This matters particularly in markets experiencing significant inflation or currency instability, where locally priced savings instruments have limited purchasing power protection.
Supply Cannot Keep Up: The Structural Deficit
The demand picture would matter less if supply were expanding in parallel. It is not. New copper mines take 15 to 20 years from discovery to production. Average ore grades have fallen around 25% over the past two decades, meaning miners must process more rock to extract the same amount of metal. Major producing mines in Chile and Peru face water scarcity challenges and increasingly complex social licence requirements.
Chile and Peru together account for roughly 40% of global mine supply. Both face structural constraints that are unlikely to ease. Meanwhile, the pipeline of new projects approved and funded today will not reach production until the early 2040s at the earliest.
The arithmetic is not complicated. Demand accelerates. Supply responds slowly. The gap widens.
Copper Demand by Sector: What Is Driving Growth
| Sector | Copper Intensity | Growth Driver |
|---|---|---|
| Electric Vehicles | ~83 kg per vehicle | Mandated phase-out of combustion engines |
| Solar Energy | 5x more per MW than gas | Government net-zero commitments |
| Offshore Wind | 8–15 tonnes per turbine | Rapid offshore wind programme expansion |
| AI Data Centres | Equivalent of 30,000 homes | Hyperscaler compute expansion |
| Grid Infrastructure | Trillions in planned spending | Grid modernisation and electrification |
| Emerging Market Construction | High per-capita as urbanisation rises | India, Southeast Asia, Africa urbanisation |
What This Means for the Physical Copper Market
Physical copper does not move through financial markets. It moves through a real logistics system: mines to smelters, smelters to refineries, refineries to LME-approved warehouses, warehouses to end users. The LME warrant system tracks ownership of metal sitting in approved storage globally.
When demand rises structurally, it is this physical system that tightens. Warehouse stocks fall, regional premiums rise, and delivery lead times extend. These are the signals that institutional copper traders watch closely, and they are increasingly pointing in one direction.
For anyone looking to understand copper as a real asset rather than a ticker symbol, the demand picture is the starting point. The supply constraints, the deficit trajectory, and the physical market mechanics sit on top of it. Together, they explain why copper is being discussed in terms that go well beyond its traditional role as an industrial input.
Frequently Asked Questions
Q: Why is copper demand rising so fast right now?
Three structural shifts are converging simultaneously: the electrification of transport (EVs use roughly 4x more copper than petrol vehicles), the build-out of renewable energy (solar uses 5x more copper per MW than gas), and the expansion of AI data centres (each requiring as much copper as 30,000 homes). These are long-term capital commitments, not short-term trends. The IEA projects global copper demand to double by 2035.
Q: How much copper does an electric vehicle use compared to a normal car?
A conventional internal combustion vehicle uses approximately 23 kg of copper. A battery-electric vehicle uses roughly 83 kg, close to four times as much. The copper is distributed across the motor, battery management system, wiring harness, and thermal controls. Charging infrastructure adds further copper demand at the grid connection level.
Q: Can copper supply keep up with growing demand?
Not at current project approval rates. New copper mines take 15 to 20 years from discovery to production. Average ore grades have declined around 25% over the past two decades, reducing output efficiency. Annual mine supply currently sits around 22 million tonnes against consumption of approximately 26 million tonnes. That deficit is projected to widen, not narrow, over the next decade. S&P Global and the ICSG both flag this as a structural, not cyclical, challenge.
Q: Is copper demand only driven by green energy, or are there other factors?
Green energy is significant but not the only driver. AI and data centre infrastructure is a fast-growing source of demand that analysts have only recently begun to model at scale. Urbanisation in emerging markets, particularly India, Southeast Asia, and sub-Saharan Africa, is adding construction and electrical demand comparable to China's industrialisation phase in the 2000s. Traditional industrial use in manufacturing and construction continues alongside these newer drivers.
Q: How does rising copper demand affect the price of copper?
Structural demand growth against constrained supply tends to tighten the physical market over time. LME warehouse stock levels, regional delivery premiums, and forward curve shape are the metrics traders watch. The price of copper is volatile and can go down as well as up; short-term movements are driven by macro sentiment, Chinese demand data, and currency fluctuations. Long-term direction reflects the underlying supply and demand balance. Past performance is not an indicator of future results.
Q: How can I gain exposure to physical copper rather than just copper-related stocks or ETFs?
Most copper ETFs hold futures contracts, not physical metal, meaning they carry tracking error, roll costs, and counterparty exposure. Mining stocks add company-specific risk on top of copper price exposure. Physical copper ownership means holding actual LME Grade A cathodes, allocated to your name, stored in a professional facility, and insured. C4CU makes this accessible from 10 kg, with live LME-linked pricing and a single all-inclusive fee.
Own the Metal Behind the Mega-Trend
Start with as little as 10 kg of LME Grade A copper cathode, stored, insured, and allocated in your name.
Start Owning Copper →
Get Copper Market Updates
Join investors receiving insights on copper prices, market trends, and opportunities. Free, no spam.
By subscribing, you agree to our Privacy Policy.
Ready to Own Real Copper?
Start owning physical copper today. Simple, transparent, accessible.